5-1-5 Assessment of a Marathoner

In endurance training, athletes understand the copious number of tests available to their coaches, but seldom do we understand exactly what those tests measure and how that translates to our athletic performance. Twenty-minute threshold test, three-minute critical power test, VO2 max ramp test, lactate threshold test—all methods of understanding an athlete’s abilities, and typically quite painful for the athlete forced to exert herself maximally for the required duration. We’ll explore some of these tests in later posts, but for now, we’ll focus on a 5-1-5 assessment using near-infrared spectroscopy (NIRS).
NIRS is a method for assessing blood flow and its oxygen saturation at the muscular level. The monitor I use is a Moxy, and they explain it more on their website. Instead of your arterial blood’s oxygen saturation (SpO2) like the doctor measures from the device on your finger, NIRS places a sensor directly on the muscle you want to target. For running and cycling, the vastus lateralis (outside of your quad) is a convenient spot with large engagement. That means that the NIRS device measures the total hemoglobin (THb) and saturated percentage (SmO2) at the capillary level of the muscle.
Using this information, we can follow blood flow into the muscle and the muscle’s ability to use the oxygen provided by your heart and lungs. The balance between these three systems—heart, lungs, and muscles—lets us determine an athlete’s relative limiter, set accurate training zones, and determine race efforts. An easy way to do this is with the 5-1-5 assessment, where the athlete exercises for five minutes at a given intensity, rests for one minute, and increases intensity for the next five minutes. Moxy provides a good article describing the different kinds of limiters and how the 5-1-5 can assess for limits. We’ll also explore this concept in a future post, but for today, we’ll look at setting zones with a NIRS assessment.
5-1-5 Assessment with Moxy NIRS
In this article, we’ll look at my recent 5-1-5 assessment and use it to set some training zones and identify limiters. In this test, I started at a 9:30 min/mi and accelerated by 30s/mile each step, ending at a 5 min/mi. Here is that test with the paces and running powers annotated.

In the above graphic, the pink line represents the percentage of my hemoglobin saturated with oxygen. The green line is the total quantity of hemoglobin in the blood in g/dL. The red line is my heart rate in BPM, and the yellow line is the power in W.
Determining Training Intensities
From the start, we can see that the easier intensities, especially slower than 8:00, are very easy and actually increase my SmO2. These are oxygenating intensities, perfect for recovery runs and warmups. At 8:00 min/mi or 245W, my SmO2 plateaus. This is an indication of my aerobic threshold, or maximal fat burning inflection point. This roughly correlates with the first ventilatory threshold in a VO2 max respiratory exchange rate test.
Getting faster than 8:00 min/mi means my SmO2 starts to decrease, though only gradually at first. In the below image, I added some approximate slope lines for the SmO2 to illustrate the change in desaturation rates.

At 260W and 280W, the rate of change is less than 1 %/min. That is quite comfortably in the aerobic range. 300W corresponded to a 1.5 %/min change, 315W a 2.1 %/min change, and 335W a 2.9%/min change. Finally, at 365W (where I nearly stumbled off the treadmill at the end of five minutes), there was a whopping 6.5%/min change.
Anecdotally, I think around a 3 %/min change is the inflection point for maximal steady state work. In the five-minute work blocks, there is not much time for the SmO2 to stabilize. I support this with a 5km time trial I did a week before this 5-1-5 assessment, where my average power was around 335W before I ramped the intensity the last couple of minutes. Depicted below, the SmO2 drops initially at a rate similar to the 5-1-5 assessment, but then stabilizes.

Finally, as we look at zones, we can also look at variance in the power-to-SmO2 relationship to help determine our maximal steady state exercise. Bellotti et al. (2013) found a maximal lactate steady state determined from NIRS and traditional lactate testing were highly correlated. They determined this value from NIRS by determining an inflection point in the power-to-SmO2 relationship.
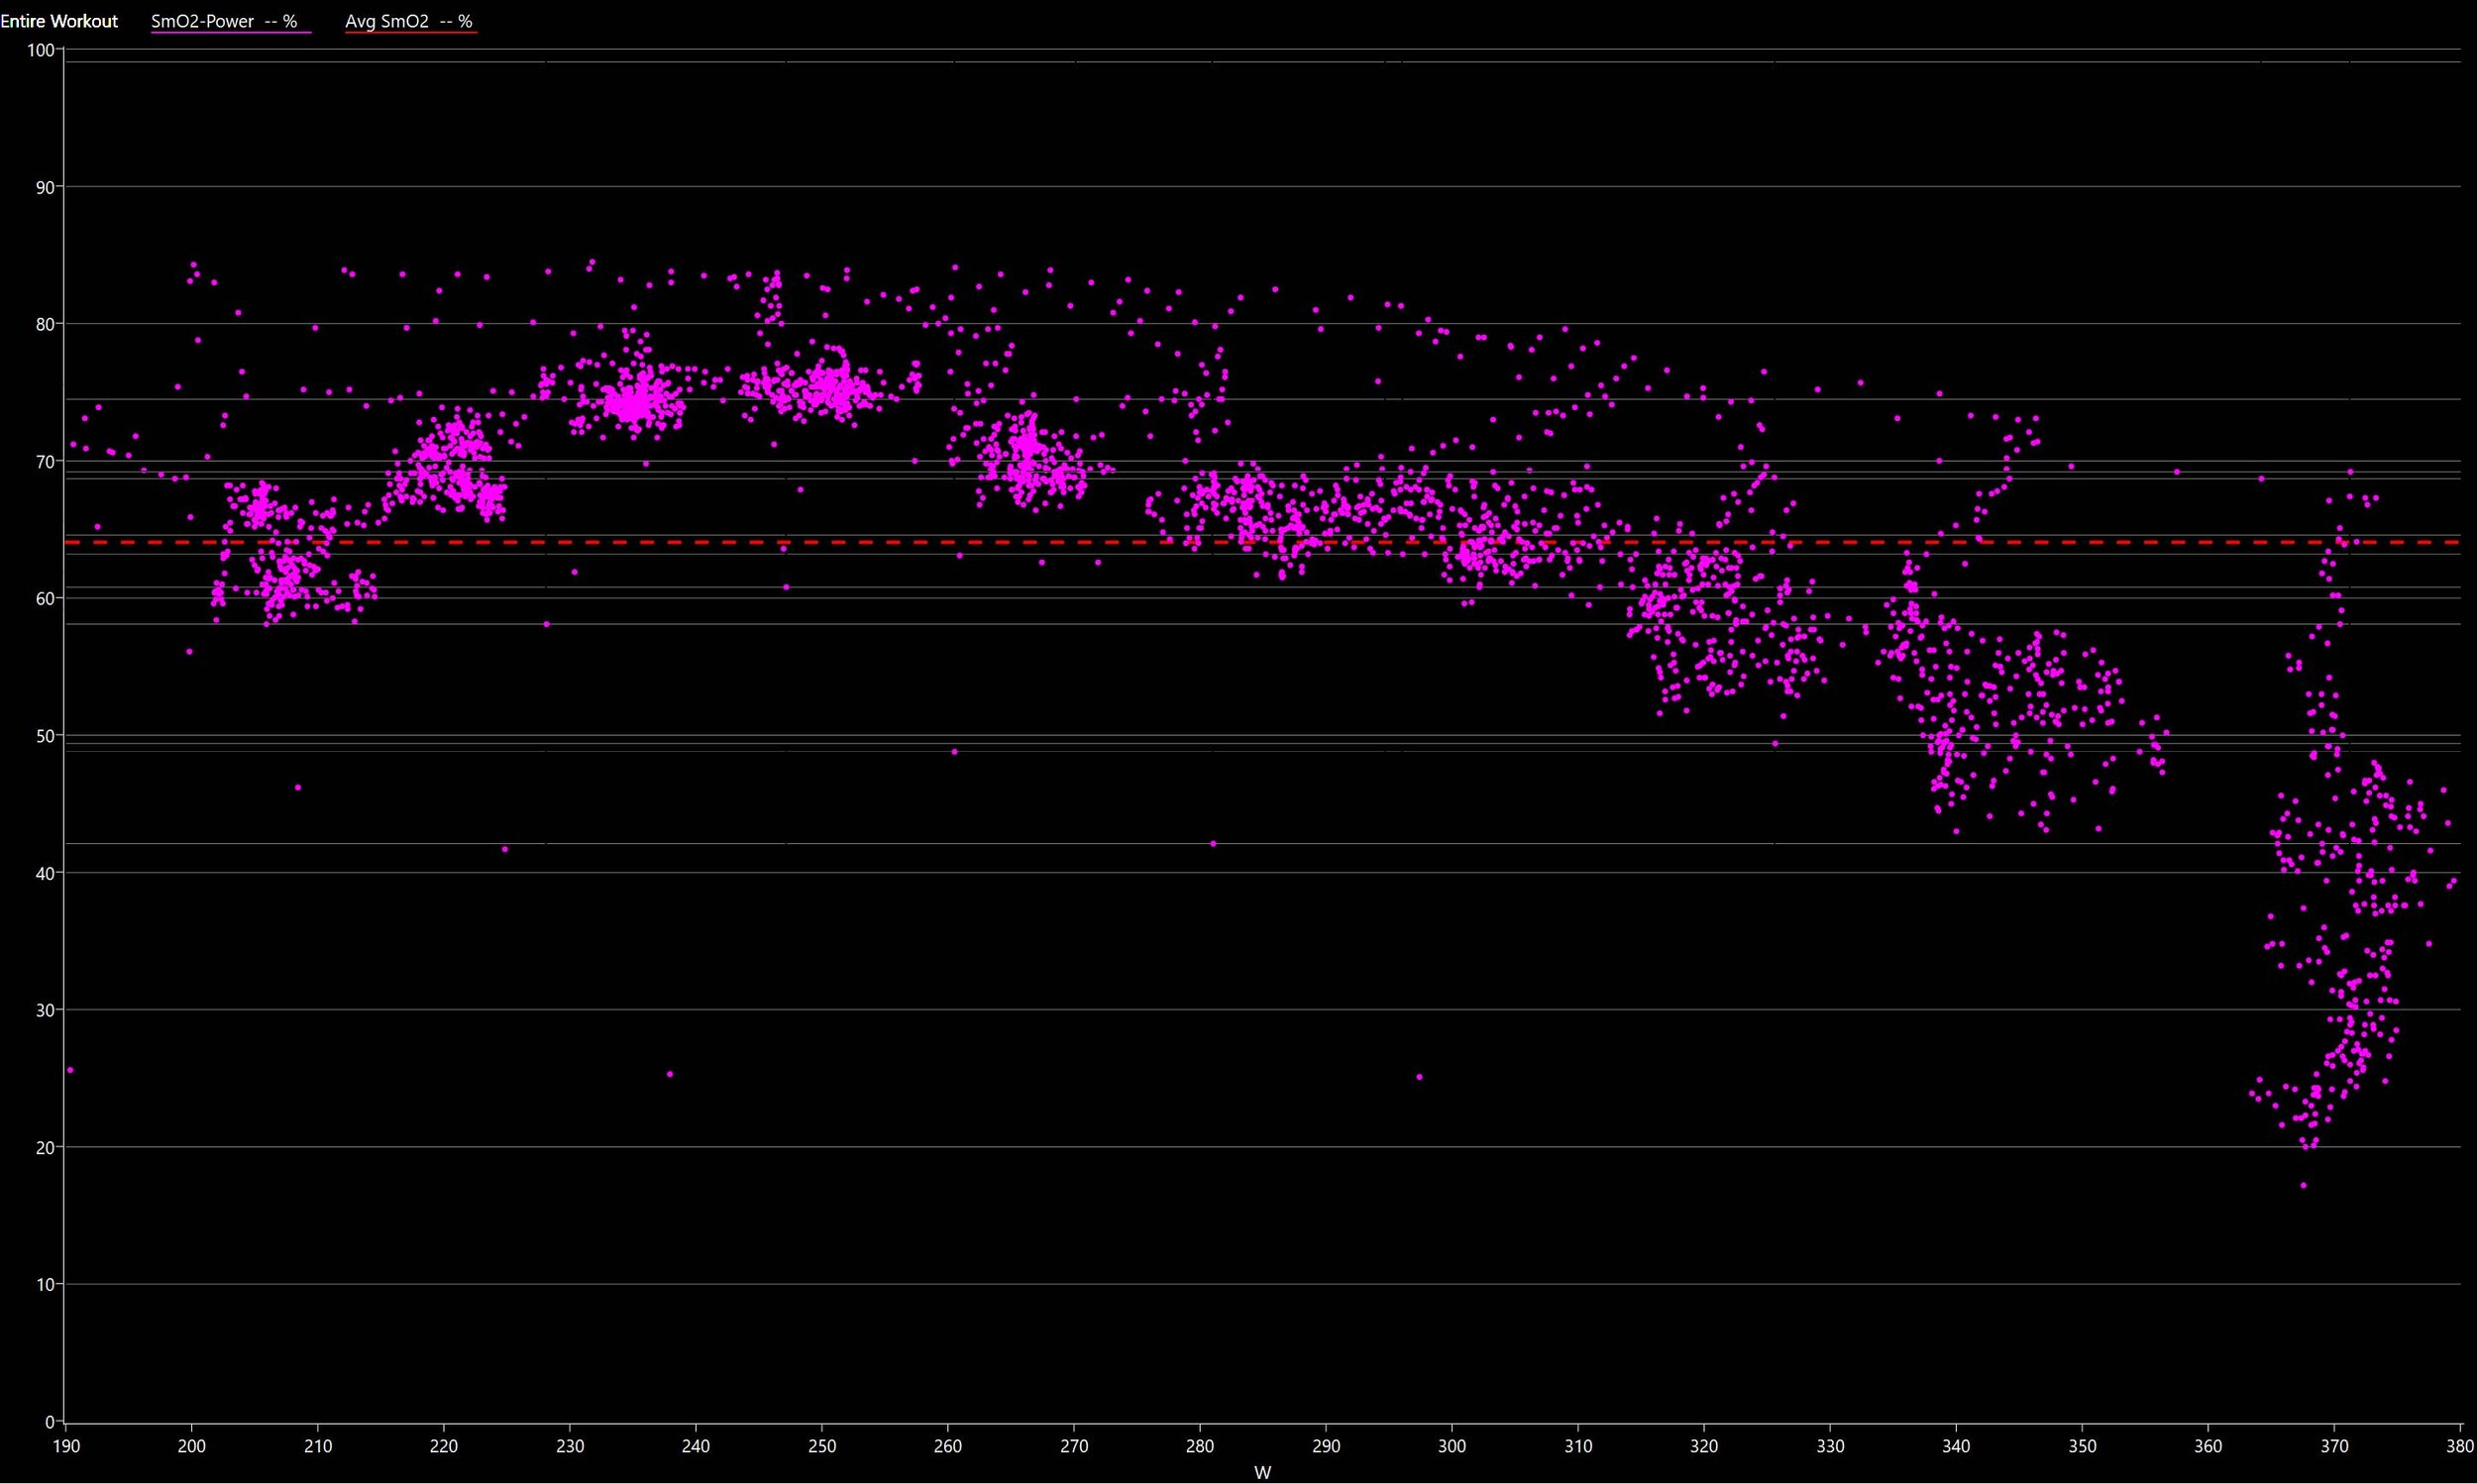
The 5-1-5 assessment differs in methods from Bellotti et al.’s study, but we can still extract useful information. In the above scatter chart, power in W is depicted on the X-axis, and SmO2 in percent on the Y-axis. We can see tight groupings of SmO2 with little variation at lower powers, with increasing variation at higher powers.
To compare my estimated maximum steady state intensity (335W) and a value above that (365W), I zoomed in on the scatters for each of those intensities. In the chart below, we can see the standard deviation of the maximum steady state is +/- 3%, and at 365W, that jumps to +/- 6.5%.

Conclusion
NIRS is incredibly useful to the coach and the athlete. For the athete, NIRS testing is far less invasive (think lactate needle pricks while you’re working hard on the treadmill) and less painful (think 60 minute power hour of pain) than other zoning tests. Beyond zoning data, 5-1-5 assessments also give us insight into an athlete’s limiters, which we’ll explore in future posts!